Claude Code plugin · v1.5.0 · verifier-gated

Charts, conjured
from your data.

Vizardry profiles any dataset, brainstorms 12 to 20 chart options across three creative bands, draws every one live with D3, and only ships the report when the verifier runs green.

>/datastorm innovation-graph/
212exemplar charts in the corpus
12–20options per brainstorm
11verifier checks, all hard gates
0network calls at render
HOW IT WORKS

From raw table to gated report

One slash command runs the whole pipeline. You bring a dataset; Vizardry brings the corpus, the taste, and the proof.

01

Profile

Reads your CSV, JSON, parquet, or SQLite. Types every column, finds the shape signature, and computes the aggregates the page will cite.

02

Brainstorm

12 to 20 options across conventional, analytical, and creative bands. Every option names a real exemplar from the 212-chart corpus.

03

Draw live

Every option is rendered from your actual data, not described. Failure modes on the cards are observed, never speculative.

04

Verify

Eleven hard checks run the page's own scripts in jsdom: charts drew, cards complete, exemplars exist. Green or it does not ship.

THE GATE

Green or it
doesn't ship.

The verifier loads the finished report in jsdom and runs its own scripts. Every chart must draw from your real data. Every option card must carry all nine fields. Every cited exemplar must exist in the corpus.

Eleven hard checks, each one mutation-tested: the suite proves the verifier fails a page broken in exactly that way, with exactly that message.

verify-report.mjs
$ node bin/verify-report.mjs earthquakes-brainstorm.html
  PASS  boot
  PASS  charts-drawn
  PASS  cards-complete
  PASS  option-count
  PASS  sections
  PASS  recommended-three
  PASS  rail
  PASS  exemplars-exist
  PASS  wrappers
  PASS  fill-markers
  PASS  mojibake
✓ 11/11 green — report ships
LIVE DEMO

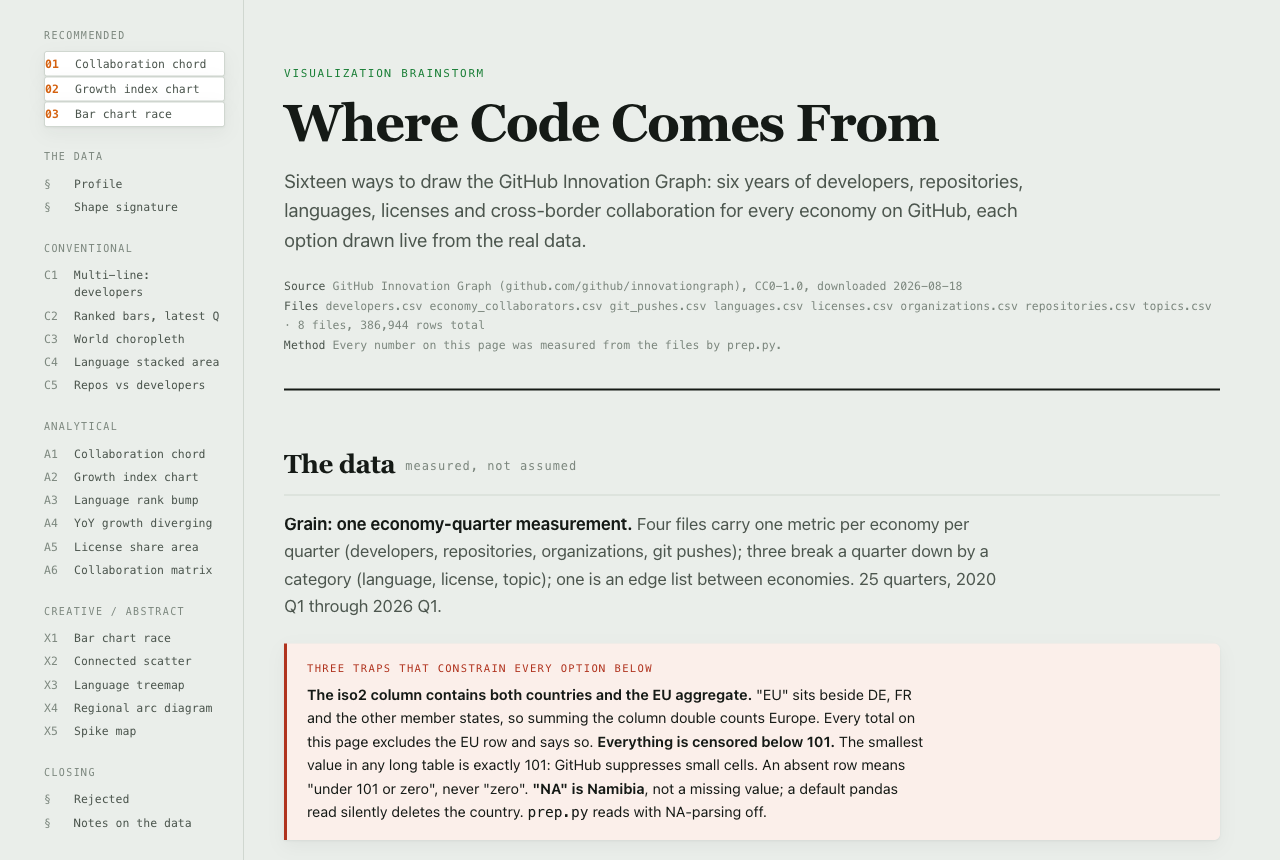
Where code comes from, sixteen ways

A real datastorm run over the GitHub Innovation Graph: six years of developers, repositories, languages, and cross-border collaboration for every economy on GitHub — 386,944 rows across 8 files, 16 drawn options, every number measured from the data. This is the actual shipped report, not a mockup.
vizardry.codeblackwell.ai
Where Code Comes From — the live GitHub Innovation Graph brainstorm report
open the live report → vizardry.codeblackwell.ai
GET STARTED

Two commands and a dataset

>/plugin marketplace add CodeBlackwell/vizardry
>/plugin install vizardry@vizardry
>/datastorm sales_2026.csv
✓ no API keys, no network at render ✓ works on any CSV, JSON, parquet, SQLite ✓ report is one self-contained HTML file